
Sign up for our LAVY email
and get our bi-monthly newsletter.

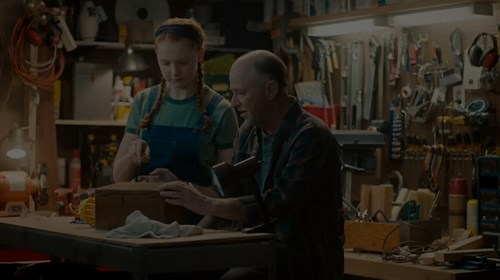
Create an anti-vaping movement by giving youth a platform to share their experiences.
SEE MORE UNVAPE WORK
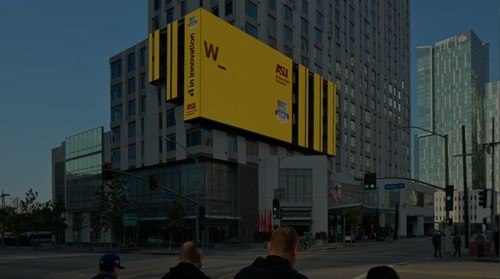
Humanize Arizona’s largest electric utility while engaging customers in a conversation about something they see as a necessary evil—the monthly energy bill.
SEE MORE ARIZONA WORK
Develop media strategies and implement buys across all platforms for more than 20 different schools/units to drive leads and enrollment.
SEE MORE EDUCATION WORK
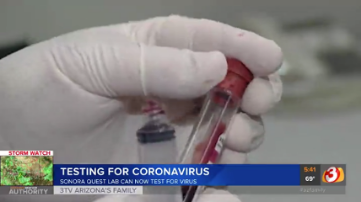
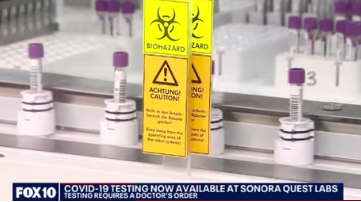
Disrupt conventional thinking that patients need a doctor’s order for all medical tests while driving awareness for Sonora Quest’s customer-ordered testing.
SEE MORE HEALTHCARE WORK

Elevate perception of a franchise-based bathroom remodeling service from local tub-liner company to major design force in bathroom transformations.
SEE MORE RETAIL SERVICE WORK

Our proprietary research gives healthcare companies unique insights into customer needs, attitudes, and what drives them to act.
