Sign up for our LAVY email
and get our bi-monthly newsletter.
This article is a brief abstract of our exclusive study that takes the guesswork
out of sports sponsorship, advertising and marketing.
Download the complete 2018 Southwest Sports Marketing Report
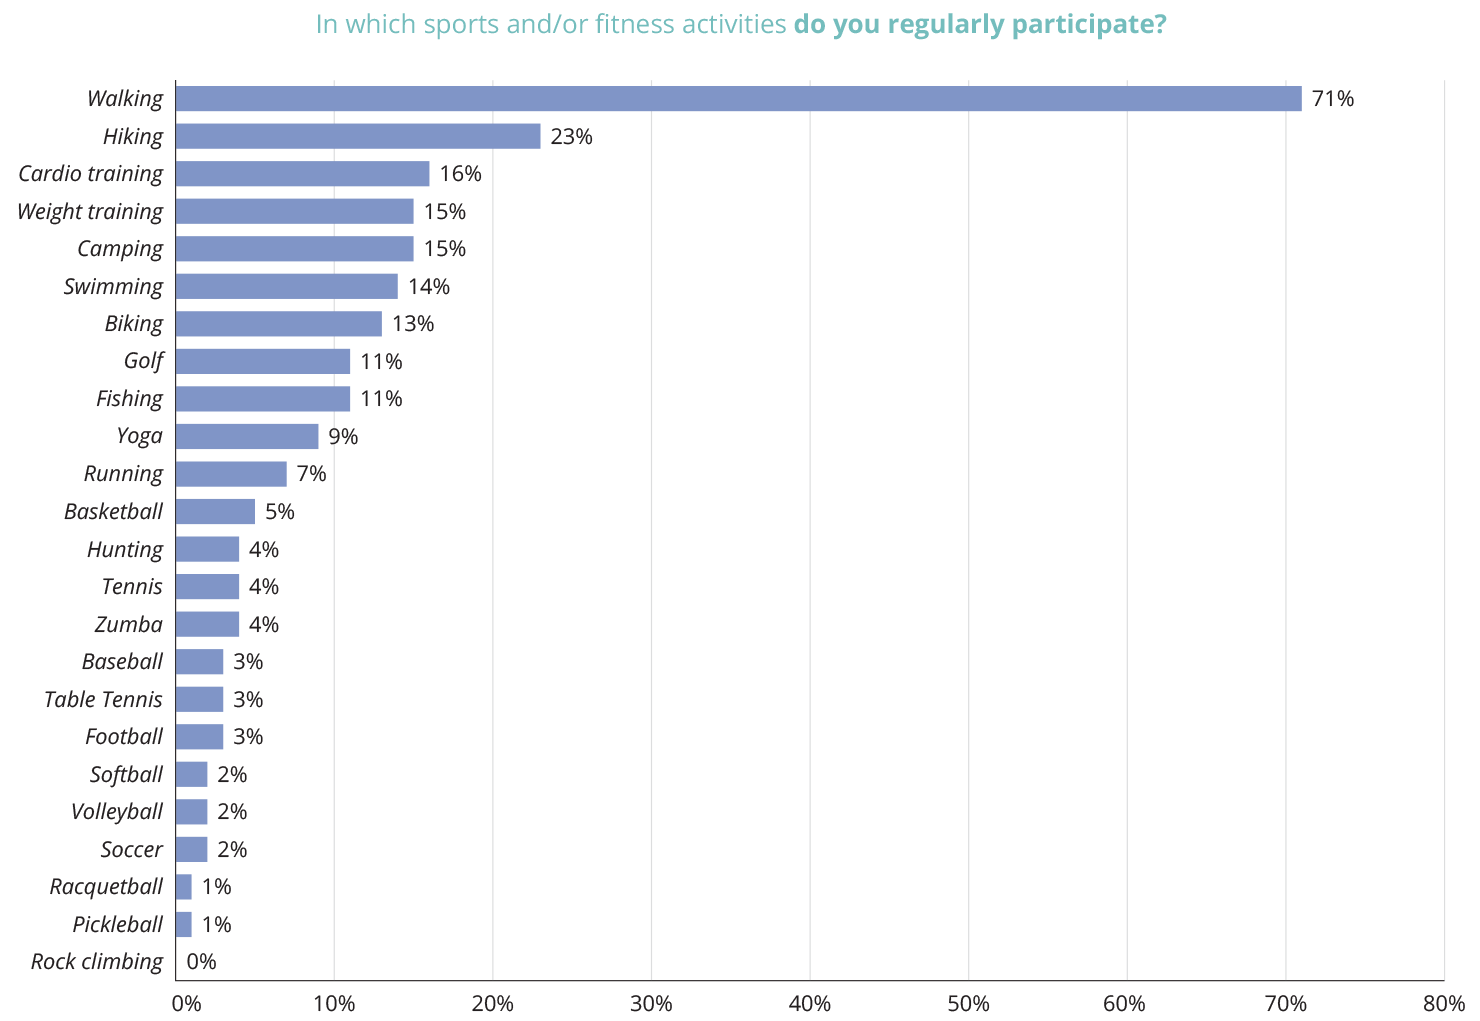
There’s no need for a photo-finish when it comes to the activities consumers participate in most often to stay fit. At 71%, walking wins easily. By a mile.
Hiking, walking’s nearest competitor in our study, captured the No. 1 rank among 23% of respondents. When you think about it, however, hiking is simply a more advanced form of walking requiring a suitable location, a bit more gear and sturdier shoes.

We’ve all seen lunchtime power walkers who temporarily swap their heels for athletic shoes. Otherwise dressed for success, they don’t seem to mind the midday fashion faux pas as long as their fitness tracker is actively counting each step.
Which brings up the topic of performance gear for walking. And it all begins with a pair of good-fitting, cushioned, supportive, and possibly even shock-absorbing athletic shoes. Package all of this in fashionable, trendy styles and you’ve got a marketplace contender.
U.S. athletic footwear generated $19.6 billion in sales in 2017, up 2% over 2016 with an average price tag of $58.16 per pair. In addition, according to data published by The NPD Group, sport leisure footwear outsold outdoor, performance, and work/occupational/safety footwear.
Sales of non-performance, athletic-inspired sneakers for adults enjoyed a 17 percent increase year-over-year during the 12-month period ending in April. The NPD Group announced in June that the men’s market, which accounts for 60% of sales, was up 10% while the women’s market was up 33 percent.
Women dominate those who identified walking as their go-to fitness activity. LAVIDGE research shows 80% of female respondents regularly participate in walking, while only 59% of male respondents do the same.
Right now, regardless of gender or gender identity, what consumers want is a nice-looking pair of shoes that also makes their feet feel good.
“As leisure footwear continues to grow, the fashion-focused players need to take the cues that comfort is not an added benefit anymore; it is a necessity for consumers regardless of the season,” said Beith Goldstein,executive director, fashion footwear and accessories analyst, The NPD Group. “Similar to their expectations of technology, function and versatility are also top of mind as consumers expect their footwear to do more than one thing or perform in a variety of conditions. Simplification is also important; consumers want less that does more.”
Fitness is often associated with youth, and for good reason. Staying in shape can help people look and feel their best. But, sometimes, to connect with these consumers, businesses need to focus in another direction to capture the largest share of the market. This certainly applies when it comes to gear associated with walking.
 That’s because walking scored reasonably high in every age category, with one noticeable difference. At 44%, less than half of millennials identified themselves as regular participants. Those 35 or older overwhelmingly said they participate in walking compared to other sports and/or fitness activities.
At age 35, the likelihood of walking regularly, compared to participating in other sports and/or fitness activities, jumps to 73%. The higher percentage holds steady into the next-higher age bracket of those at least 55 years old.
As simple as it is, walking offers a significant opportunity beyond athletic shoes. Serious walkers buy everything from pedometers to fitness trackers, although fitness apps designed for smartwatches are steadily displacing fitness-related wearable tech. Walkers also need water bottles, and they often prefer to dress in comfortable, moisture-wicking clothing. Think Bluetooth headphones, armbands for smartphones, and the list goes on and on.
One could design each of these—and market them—mostly to the sexy, younger crowd.
Sports marketers in 2018, however, would be better served by reaching out with styles, colors and message aimed at more mature buyers who simply want to feel young. Educate them on why they need what you’ve got. The numbers will be squarely in your favor.
Have you ever wondered how income level impacts one’s participation in sports and fitness? We did, so LAVIDGE set out to uncover exactly which activities appealed most to respondents with household incomes of at least $75,000.
Here’s the breakdown:
It turns out that, similarly to the average respondent, walking and hiking topped the list. But the similarity ends there.
Weight training, which overall ranked third, held steady. Swimming finished a few strokes behind capturing fourth place among respondents from more affluent households.
In contrast, less affluent families earning less than $75,000 in annual household income, rounded out their top five with camping, bumping the water-based sport down to their sixth-most popular participation sport or fitness activity.
Cardio, third-highest ranked overall, failed to make the top five among more-affluent respondents.
Finally, affluent families are more likely to golf than their less-affluent counterparts. While it ranked fifth among those with higher incomes, it dropped to eighth-most popular activities among those in households earning less than $75,000 per year.
We know, we know. Women are breaking down barriers all the time. It wasn’t that long ago that women weren’t allowed to run in the Boston Marathon. And now they account for a significant percentage of participants—including this year’s winner, Desiree “Desi” Linden.
Even so, our study revealed a higher percentage of males than females claim to regularly participate in what are traditionally considered the most competitive sports. Here’s how it breaks down:
The message here is clear. Unless you own, and we mean own, the women’s consumer product lines in these sports segments, the profitability of “going big or going broke” likely isn’t there. Sports Business Daily reports that women’s sports share in less than a half of one percent of all corporate sports sponsorships. The publication also considers it an untapped opportunity worthy of being explored.
Women’s golf is the shining exception. That’s because name-brand women’s clubs, golf bags, apparel and shoes are readily available for sale. The Ladies Professional Golf Association enjoys lucrative sports marketing sponsorships as well. Leaders Cosmetics and Pure Silk take advantage of the LPGA’s visibility among women to get their products in front of their fans. But being geared toward women isn’t a requirement. Acer, Arpin Van Lines, Dow and Kia are among the majority of LPGA sponsors with no direct tie to gender-specific products or services.
The LPGA also shares at least two golf-related sponsors with the PGA, including Rolex and Titleist, each of which offers separate product lines for men and women.
Monetization of other women’s sports organizations pales in comparison.
The Women’s National Basketball Association does bring in revenue from paid sponsorships, mostly in the form of paying to have logo patches sewn into players’ jerseys. They also share some sponsorships with the NBA including Mobile Motor Oil. But it is nowhere near as lucrative as its counterpart with male athletes.
Women’s baseball has a small, yet growing audience—but it’s mostly overseas.
In 2016, approximately 100 million households watched on television and another 6 million online viewers from 198 countries and territories tuned in for the LG Women’s Baseball World Cup played in Gijang, South Korea. The South Korea-based electronics giant first sponsored the event in 2014 by hosting it in Incheon, South Korea, promoted as the inaugural LG Cup 2014.
This year, the event overseen by the World Baseball Softball Confederation (WBSC), was played in the United States for the first time since it launched in 2004. Drumming up viewership for the biennial event began in earnest in July with a WBSC Women’s Baseball World Cup trophy showcase taking place across five MLB stadiums including the homes of the Washington Nationals, New York Mets, Florida Marlins, Tampa Bay Rays and Atlanta Braves. The main event followed August 22nd through August 31st in Viera, Florida, with Japan winning its sixth consecutive gold medal.
“The trophy tour’s six destinations will help build national excitement among sports fans and shine the biggest spotlight ever on the WBSC Women’s Baseball World Cup 2018 and women’s baseball in general,” WBSC President Riccardo Fraccari said in a press release. Fraccari added that the trophy tour would not be possible without the support of Florida’s Space Coast Office of Tourism, Major League Baseball and its Clubs, and the United States Specialty Sports Association (USSSA).
USSSA CEO Don DeDonatis couldn’t be happier.
“USSSA is excited and honored to have been awarded the hosting rights to our very first National Team event and official baseball world championship, the WBSC Women’s Baseball World Cup 2018,” he said.
In contrast, consider women’s tackle football. CNN Money offered a peek inside the world of three 11-on-11 full-contact women’s amateur leagues comprised of about 4,000 female players in total. While their numbers are few, those who do play spend thousands each year on league fees, travel expenses and specialized gear. Shoulder pads, along with padded sleeves for forearms, elbows, knees and more, are only available in women’s versions and sizes from a limited number of athletic brands such as Nike and Douglas. Their pay-to-play leagues do have fans, but not enough to support major sports endorsements. The monetization simply isn’t yet there.
Meanwhile, billions of dollars pour in annually to sponsor the National Football League, Major League Baseball, the National Basketball Association, the National Hockey League and more. Team licenses for products, partnerships, broadcast rights, and more speak to fans in ways nothing else can.
It all began with golf and an unassuming player's penchant for iced tea and lemonade which led to a namesake nonalcoholic beverage and millions in sponsorships.
In fact, the Professional Golf Association has a lengthy, proud history of successful sports sponsorships. Widely celebrated golf champion Arnold Palmer was one of the original athletes to endorse major brands. Cadillac, Pennzoil, Hertz, Rolex and many others paid him millions to attach their name to his.
This year, Charles Schwab & Co., a long-time supporter of the PGA Tour, landed title sponsorship of the Colonial Country Club event in Fort Worth, Texas. The sponsorship is teed up to begin in 2019 and run through 2022. It’s just one among many non-sports-related businesses to back the tour including OfficeMax and Mercedes Benz.
PING, Titleist, FootJoy, Aquafina, Gatorade, TaylorMade-Adidas, Golf Digest, and others round out the current sponsorship lineup of PGA, which describes itself as one of the world’s largest sports organizations.
As it turns out, ranking fifth among affluent consumers is a nice place for a sport to land in the world of professional sports marketing and sports sponsorships.
The “IBISWorld Industry Report for the Golf Industry in the US” reveals:
The cold-weather sport of skiing also performs well in sports marketing sponsorships. The “IBISWorld Industry Report for Ski & Snowboard Resorts in the US” reveals:
Without a doubt, sports sponsorship can be expensive. But the return on investment is there.
Just ask those who contributed to an article published in Finance Magnates including Olga Rybalkina, CEO of FXTM which sponsors India’s F1 Team, Sahara Force.“Sports sponsorship cuts through the clutter and exposes the brand to far more people than a publication or even above-the-line advertising,” Rybalkina said in her interview. “People love sports and, by default, any company that sponsors a popular team or individual is going to get attention.”

This article is a brief abstract of our exclusive and authoritative study that takes the guesswork out of sports advertising and marketing. Rather than speculating about what will drive consumers to action, we've asked them.
Sign up for our LAVY email
and get our bi-monthly newsletter.